
In the digital world, decisions are made based on data. Data that is collected on your users’ behaviour and interaction with your web assets. After today’s article, you’ll be able to understand the art of tracking through google analytics and the 10 most important metrics to track in google analytics to make better, data-driven decisions. However, before we dive into the term “Metric”, let’s talk a little bit about Google Analytics for those who are unfamiliar with the tool.
What is Google Analytics?
Google Analytics is a free, web analytics platform by Google that collects data from your websites and apps to create reports that provide insights into your business. When used in conjunction with other tools like Google Ads, Google DataStudio, Google Optimize, etc., this tool can be used to make accurate, data-driven decisions that help you get closer to the goals that you’ve set for your business.
A free tool available to anyone with a google email, you can set up Google Analytics for your website or apps by clicking this link.
What is a metric in Google Analytics?
Now that we know what the google analytics platform is and how we can set it up, let’s look at the term in question – Metric.
According to the support documentation provided by the team at Google, Metrics are quantitative measurements. For example, The metric ‘Sessions’ is the total number of sessions on a page or web asset. Another example is the ‘Pages/Session’ metric which is the average number of pages viewed per session.
Data from metrics can be further improved or narrowed down by adding dimensions to them. Dimensions are qualitative attributes to your quantitative metrics. For example, ‘City’ or ‘Country’ is a dimension that can be added to the metric ‘Sessions’ to give you the total number of sessions originating from a particular geographical location.
Metrics and Dimensions are never to be confused with each other. A rule of thumb is: Metrics are quantitative numbers while Dimensions are qualitative attributes.
Now that we understand what metrics are and how they’re different from dimensions, let’s look at the 10 Most Important Metrics that every business must track on Google Analytics.
Traffic Metrics – Sessions & Users
For obvious reasons, every business owner or stakeholder is interested in knowing how many people are visiting your website. This information can be easily obtained by analyzing two metrics – Sessions which is the total number of visitors and Users which is the count of unique visitors or unduplicated visitors. In most cases, a higher number of Sessions or Users equates to a more successful business and is also a strong indicator that your brand is desired by users in the digital space. Of course, increased traffic may not always mean more revenue if people visiting your website don’t become customers. More on this later.
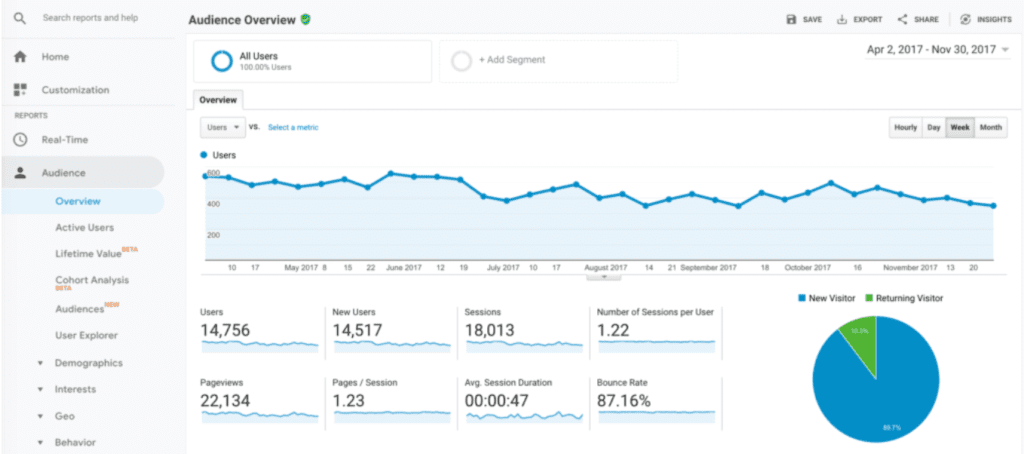
Pages Per Session
This is an important metric that you should track to see how engaged your visitors are. Pages per session, as the name suggests, is the average number of pages a user views during a session. An increase in this number most likely means that your visitors are more engaged with your brand and are interested in viewing more information about the services or products you’re offering. On the flip side, if your website consistently sees a decline in pages per session, it may be time to revamp your content or improve your funnel and customer journey.
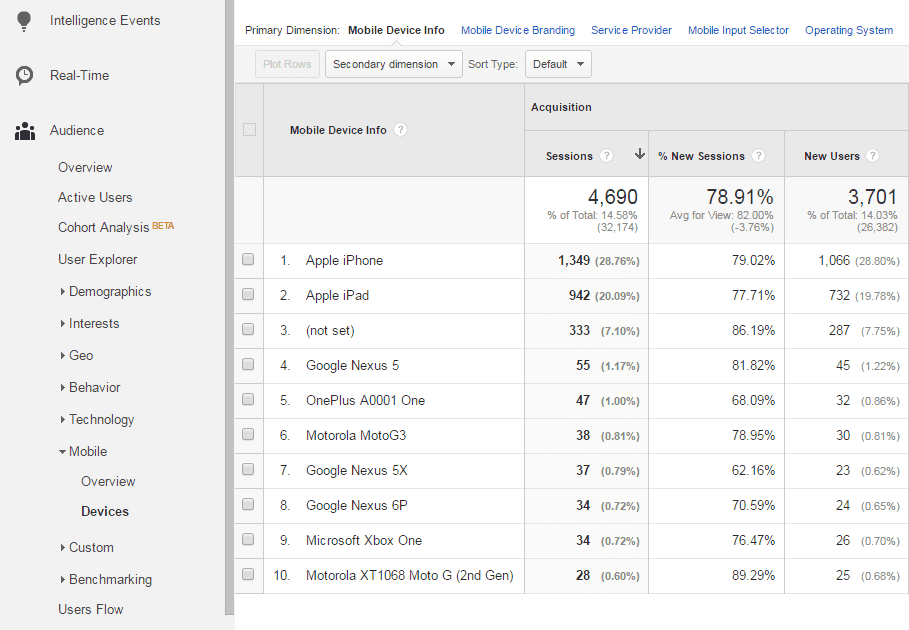
Devices
This is an important metric to keep an eye on from a UX/UI and Conversion point of view. The ‘Devices’ metric gives you an overview of the number of visitors browsing your website from Desktop, Mobile or Tablet respectively.
When choosing to make improvements to the user experience based, this metric comes in handy when you want to prioritize certain changes over others. For example, if you have 90% of your traffic coming from mobile, you’d rather focus on making UX improvements to the mobile experience first before moving on to the desktop and tablet experience. You may also be able to tailor offers that incentivize conversion for traffic coming from a particular device if you choose to.
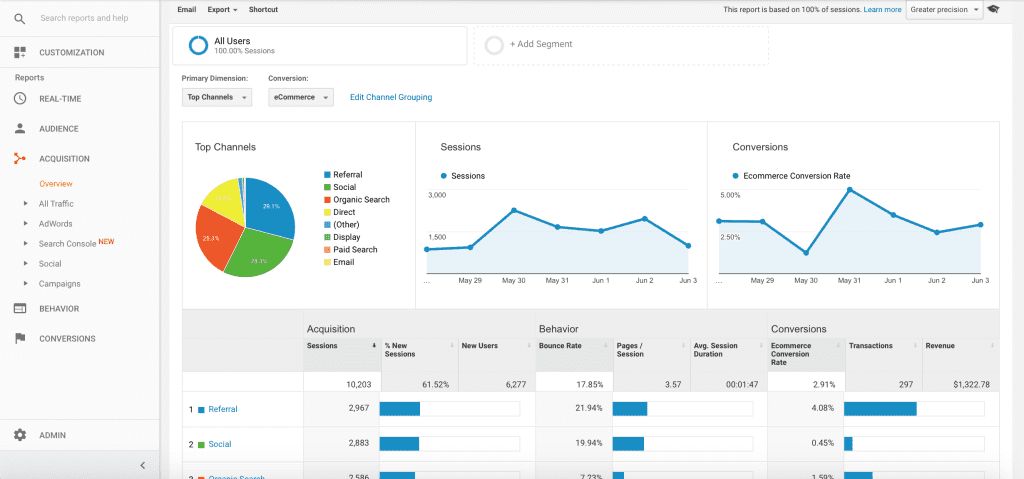
Source
A metric that marketers love to keep track of, the ‘Source’ metric in Google Analytics refers to where the traffic on your website comes from. For example, the traffic can come from a search engine like Google, or direct to your website by typing the URL. Sometimes, you may see an ‘unknown’ column for traffic that arrives from masked or unidentified sources.
This metric can be very helpful in identifying your biggest sources of traffic, conversion and revenue to help you plan your marketing strategies comprehensively. It can also help validate and benchmark previously implemented strategies. For example, if you recently spent a chunk of your budget on Search Engine Optimization and traffic from search sources hasn’t increased, it is likely that your SEO practices aren’t working and you may have to revisit the drawing board.
Medium
The medium metric is the general category of how the user arrives at the web asset. For example, the users on your website can come through Organic Search, Social, Paid Search (ads), etc. This metric in conjunction with the ‘Source’ metric can greatly improve your marketing strategies’ decision-making and validation process.
Average Time on Page
The ‘Average Time on Page’ metric is the average amount of time users spend on a single page. By looking at the average time on page metric, you can gauge how engaged users are with a particular page – this is especially true if you have a page full of information. For example, if you have a page with detailed info about a service your company provides and the average time on the page is about 10s, your users are probably not convinced with the information or interested enough, causing your conversion rate on the page to be low.
The average time on page can be viewed by going to Behaviour>Site Content>All Pages>Avg. Time on Page (column)
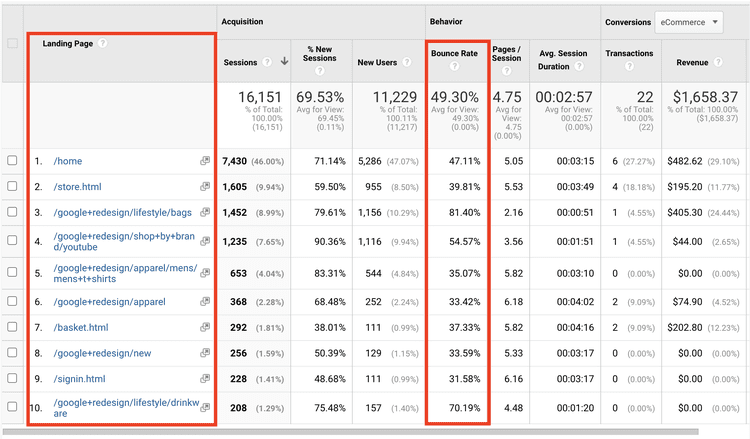
What is a Metric in Google Analytics? (and 10 most important metrics to track) Click To TweetBounce Rate
A bounce is defined as a single-page session on your website. When a user visits just one page on your website and leaves, it is registered as a bounce. The bounce rate is the percentage of all sessions on your website that bounced. This is quite an interesting and important metric because this gives you a lot of insight into the effectiveness of your top-of-funnel marketing strategies. If most of the users you acquire are bouncing, it is likely that your top-of-funnel acquisition strategy is inaccurate and that you’re targeting the wrong audience. In other cases, it could also be an indication that your landing page design or user experience is ineffective or sub-par.
It is also important to note that if a page is meant to drive traffic to another page (ex: product category page) then a high bounce rate (>70%) means that there is room for improvement on the page or its content. on the flip side, if the page is path end like a thank you page with a 90% bounce rate, there’s probably nothing to worry about there.
Page Views & Unique Page Views
In Google Analytics, ‘Page Views’ is the total number of views for a particular page including scenarios where one user views the same page multiple times. On the flip side, ‘Unique Page Views’ takes into account how many times a page is viewed in the same session. if a user goes to the same page multiple times in a session, it is considered as one unique page view.
To view Page Views & Unique Page Views, go to Behaviour>Overview
By mastering the implementation of Google Analytics and effectively tracking the 10 metrics discussed above to draw accurate conclusions, one can take their business to new heights, maximize the ROAS and web ROI and at the same time, improve the user experience on their website. No matter the size of your business, these 10 metrics are ones that will always stay relevant and help you scale and optimize minute aspects of your web assets.
Can’t set up Google Analytics to track these metrics yourself? Contact us and our team of experts will help you out.
Frequently Asked Questions (FAQs)
Q. Is google analytics free?
A. Yes, google analytics is a Free tool by google.
Q. How can I set up Google Analytics?
A. Here’s a step-wise guide to setting it up by our friends at Hootsuite.
Q. Are these the only metrics on Google Analytics?
A. No, there are thousands of other preset metrics that you can track and also custom events that you can set-up and track on GA.
We are dedicated to sharing useful content for WordPress websites in the business & personal communities. This includes any related topics indirectly related to WordPress, marketing, advertising, e-commerce, technology, or any other online subjects we feel would benefit our readers and customers.
Nick @ The WP Website Help Team