
If you’re in the eCommerce space or are planning to expand your retail business to the online world, read on because, In this article we will cover the basics of data collection and tracking for your eCommerce store.
What is eCommerce Analytics?
Simply put, eCommerce analytics is the study of data on your customers to derive predictive strategies that help achieve business goals. Depending on the size of the businesses based on revenue, order volume, etc., businesses may choose to track anywhere between a few data points and thousands of data points on their customers. This data is then used to understand your customers and their behaviour, which can be leveraged to deliver a better shopping experience to your customer. In most cases, the improved shopping experience helps increase revenue.
How do I set up eCommerce Analytics?
While there are multiple paid and free solutions that can help you get started with analytics for your store, one free tool that works universally is Google Analytics. As the name suggests, this is a free tool that is officially part of the Google suite and anyone can get access to a plethora of customer, sales and performance data using Google Analytics. No matter how big or small your eCommerce store is, we recommend using Google Analytics as a part of your eCommerce Analytics set-up.
In addition to Google Analytics, some companies choose sophisticated tools like PowerBi, Google Data Studio, Triple Whale, etc. These tools, in combination with GA, allow you to track inventory data, off-line sales & performance data, and data from 3rd-party tools meant for human resource management, product development and such.
Since this is a Beginner’s Guide to eCommerce Analytics, in this article, we will focus on metrics that can be tracked on Google Analytics. To get started with GA, click here.
Why is it Important?
Here’s why eCommerce Analytics is important for your business:
- Analyzing sales and production data helps you build a robust supply chain
- Customer order data and behaviour can be analyzed to prevent fraud and fraudulent transactions
- Tracking data year over year can allow you to identify trends based on seasons, occasions and other factors. Planning an assortment that fits these trends can help you scale better and faster
- Customer data can help you create an improved and personalized shopping experience for different types and tiers of customers
- Data tracking helps improve forecasting and inventory planning
- Tracking eCommerce data can help you make marketing and advertising more measurable
- Optimizing pricing and promotions becomes much easier with eCommerce analytics
The 5 Metrics to Track
Now that we’ve seen the What, How and Why of eCommerce Analytics, let’s look at the 5 most important metrics every eCommerce business must track for success.
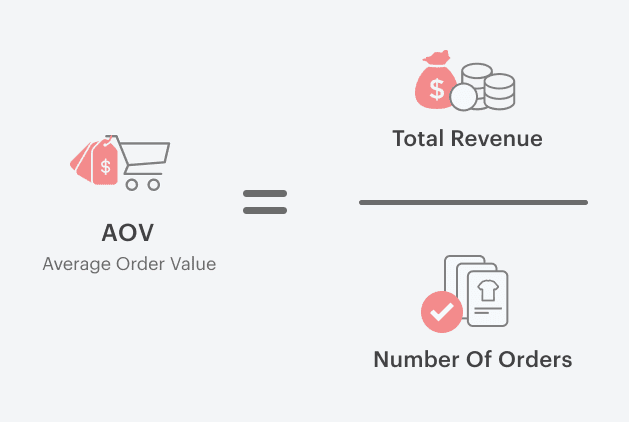
Average Order Value
The average order value (AOV) tracks the average dollar amount spent each time a customer places an order on your eCommerce store. To calculate the average order value (AOV), simply divide the total revenue by the number of orders.
For example, let’s say your store’s revenue for the month of August was $50,000 and you had 850 orders in the same month. In this case, your average order value is $50,000 divided by 850 = $58.83.
AOV is a key performance indicator that online businesses measure to understand their customers’ purchasing habits. Like other key metrics, AOV can be tracked for any time period, but most companies monitor the moving monthly average. Since there is a transaction cost associated with each order, often times, increasing your AOV is a way to drive direct revenue and increase your profits when customers are already buying from your store.
Conversion Rate
eCommerce conversion rate is the percentage of visitors to your eCommerce store that complete a purchase. Dividing your total number of conversions by your total number of website visitors, then multiplying that figure by 100, will determine the conversion rate percentage for your eCommerce business. Normally, the higher the conversion rate on your store, the better your profits as it costs quite a bit to acquire traffic to your store these days.
Optimizing your store for improvement in conversion rate is something that most businesses these days spend time, money and effort on as this can drastically affect their bottom line. With a sound eCommerce analytics setup, this optimization can be made even easier and, better yet, measurable.
Beginner's Guide to eCommerce Analytics Click To TweetCustomer Acquisition Cost
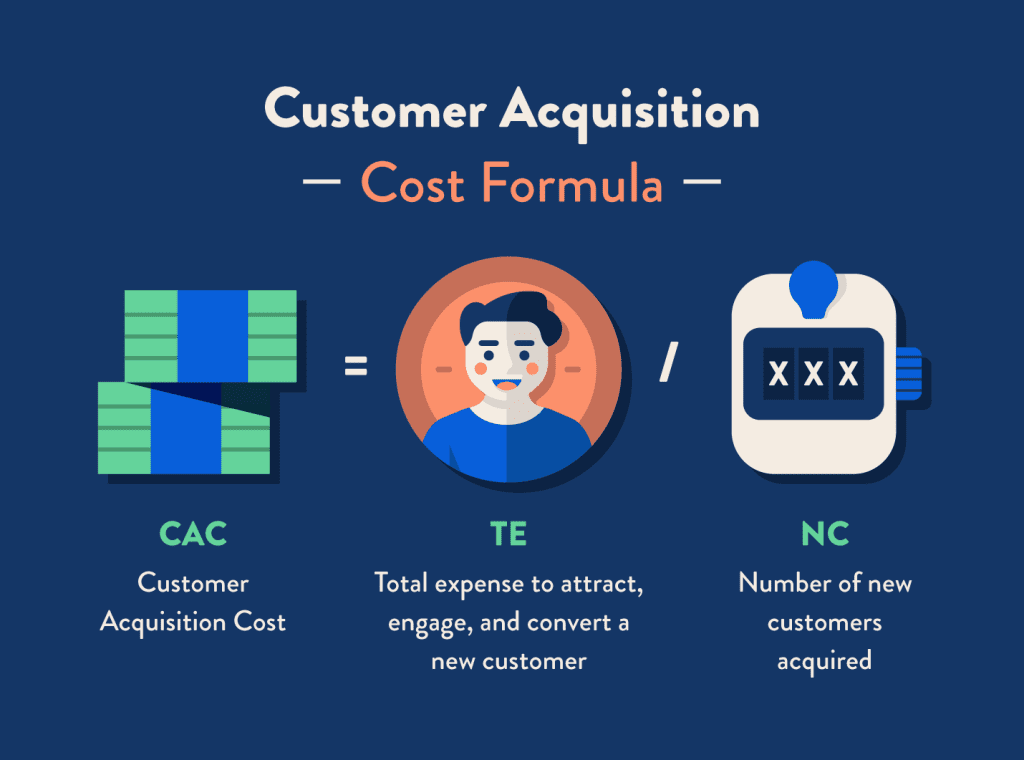
Customer acquisition cost (CAC) is the dollar amount you spend to get a new customer for your eCommerce store. This number helps measure the return on investment of efforts to grow your customer base. CAC is calculated by adding the costs associated with converting prospects into customers (marketing, advertising, influencers, and more) and dividing that amount by the number of customers acquired.
We recommend tracking total CAC as well as CAC by channel so that you understand over a period of a few quarters which channel has done well for you and which hasn’t. Here’s an example of how CAC is caluclated –
If an organization spent $10,000 on marketing in a year, and it was able to acquire 1,000 new customers, the CAC would be $10 because $10,000 divided by 1,000 customers equals $10 per customer.
On the other hand, if the company brought in 500 customers, their CAC would be twice as high, or $20, because they spent the same amount of money and brought in half the number of new customers.
Customer Retention Rate
The customer retention rate is the percentage of existing customers who remain customers after a given period. Your customer retention rate can help you better understand what keeps customers with your company, and can also signal opportunities to improve customer service.
How do you calculate customer retention rate?
- To determine your retention rate, first identify the time frame you want to study
- Next, collect the number of existing customers at the start of the time period (S)
- Then find the number of total customers at the end of the time period (E)
- Finally, determine the number of new customers added within the time period (N)
Finally, plug the values in this formula to calculate the customer retention rate: x 100 = CRR
For example, let’s consider an apparel store that had 100 customers at the start of the period (S), ended the period with 100 customers (E) and added 10 customers over the period (N). They would have a customer retention rate of 90 percent: x 100 = 90 percent.
According to Bernard Meyer, an eCom marketing specialist at Omnisend, CRR shows how ‘sticky’ your products (or brands) are.
Customer Lifetime Value
Customer lifetime value is the total revenue in dollar amount an eCommerce business earns from a customer over time. It takes into account all their orders ever. It is a good metric to size up customer satisfaction, loyalty and the viability of a brand.
There are two ways to calculate the CLV of an eCommerce store – (1) Accumulated Data Method, (2) Average Estimated Method.
If historical sales data is available, the Accumulated Data Method can be accurate and in this case, CLV=order 1 + order 2 + order 3… + order N.
If contiguous historical data is unavailable, the Average Estimated Method can be used. in this case, the Customer Lifetime Value = Average Order Value x N. (where N is the number of orders)
Although we’ve seen the 5 most important metrics to track for your eCommerce store, these are just a handful of many metrics that you can track to devise sound business strategies. You can contact our team here if you’re looking for expert guidance on setting up a full-fledged analytics platform.
FAQs
Q. Is the investment in analytics worth it as a new business?
A. Absolutely, new businesses can benefit from an analytics setup. Remember, the sooner you set up analytics for your businesses, the sooner you can make data-driven decisions.
Q. What does it cost to implement data tracking for eCommerce in-house?
A. You’ll need at least one data scientist/analyst on your team and the salary for such an expert ranges from 50K-190K annually.
Q. How do I track online and offline data simultaneously?
A. using GA in combination with PowerBi can help you achieve this.
We are dedicated to sharing useful content for WordPress websites in the business & personal communities. This includes any related topics indirectly related to WordPress, marketing, advertising, e-commerce, technology, or any other online subjects we feel would benefit our readers and customers.
Nick @ The WP Website Help Team